
Monitoring & Reporting
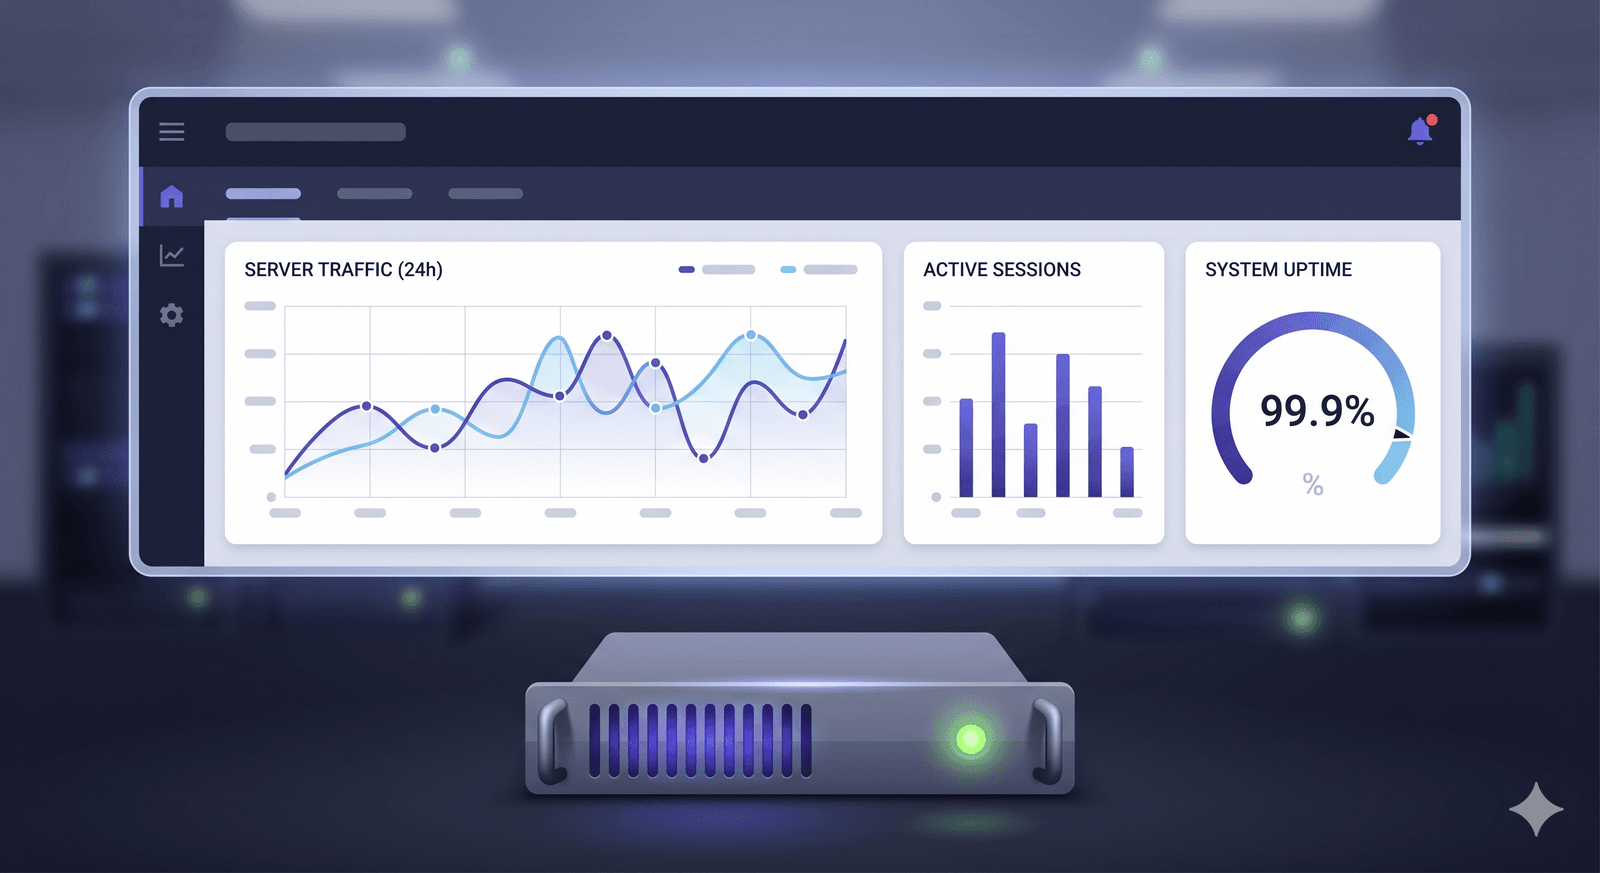
On any Server Trafficweb deployment you can add 24/7 monitoring, real-time alerts and clear performance reports — catch issues before users notice, plan capacity with confidence.
🎉 Join countless satisfied clients who trust us to power their digital ventures. Ready to experience unmatched reliability and support?
On any Server Trafficweb deployment you can add 24/7 monitoring, real-time alerts and clear performance reports — catch issues before users notice, plan capacity with confidence.
The Monitoring and Reporting add-on is what turns your dedicated servers, VPS, cloud instances and storage servers from black boxes into a service you can actually operate. It is the most boring add-on in the catalogue and also one of the most powerful: every other operational improvement — capacity planning, performance tuning, security response, SLA reporting — depends on having real data about what your infrastructure is actually doing, second by second. Without monitoring you guess; with it you decide.
The monitoring stack starts with fine-grained infrastructure metrics. CPU load, queue depth and run-queue length tell you if the box is keeping up with the work it has been given. Memory, swap and cache pressure tell you whether the application needs more RAM or is paging to disk. Disk capacity, IOPS and latency tell you whether storage is becoming a bottleneck and at what rate it will fill up. Network throughput, packet loss, retransmits and connection counts tell you whether bandwidth, DDoS or upstream issues are the next concern. All of this is collected every few seconds, retained for analysis and visualised on dashboards your team can actually read.
On top of infrastructure metrics, service-level checks verify the things your customers actually experience: is the web server responding within target latency, is the database accepting queries fast enough, is the streaming origin emitting HLS segments at the expected bitrate, is the API returning the right HTTP codes. Custom checks can probe any endpoint or run any script — so your business-specific signals (queue depth, queue age, transaction volume, payment success rate) live alongside the infrastructure metrics for a complete picture.
The benefits multiply across the operation. Alerts route to the channels your team actually watches — email, Telegram, Slack, SMS for critical — with thresholds tuned so you get real signals, not alert fatigue. Dashboards show the fleet at a glance for daily standups and incident response. Reports close the loop: weekly and monthly summaries spot trends (rising disk usage, creeping latency) before they become incidents, and ad-hoc reports support capacity planning, post-incident reviews, customer-facing SLA proof and budget conversations. Pair Monitoring and Reporting with Backup Solutions, DDoS protection and Firewall and Security to bring every operational service into one observability plane.
Key Benefits
Fine-grained collection of CPU, RAM, disk, network and OS metrics every few seconds. The dashboards always reflect what is happening right now.
HTTP, TCP and custom probes verify what your customers actually experience — not just whether the box is up, but whether the service is responsive and correct.
Threshold and anomaly-based alerts tuned with your team so genuine issues reach the right people fast and routine fluctuation does not become alert fatigue.
Continuous checks verify services stay online and responsive, with historical uptime statistics for SLA reporting and customer-facing transparency.
Dashboards reveal trends that guide capacity planning, tuning and budget decisions over time — not just today but week over week and month over month.
Alerts via email, Telegram, Slack, SMS or webhooks, with critical alerts routed differently from informational ones to fit how your team really works.
Add application-specific metrics (queue depth, transaction count, error rate) alongside infrastructure metrics for a complete operational picture.
Weekly and monthly summaries support post-incident reviews, compliance audits and customer-facing SLA reporting with timestamped data behind every claim.
Built for real workloads
Catch CPU saturation, memory leaks, disk-fill events and slow-query patterns before they cause outages for real users — not after a customer complains.
Provide customer-facing uptime statistics, incident timelines and response times with auditable data behind every number. SLA conversations get easier.
Spot rising trends in resource use weeks before they become problems. Plan performance upgrades and hardware upgrades based on actual data.
Demonstrate to auditors that systems are continuously monitored, with documented alert thresholds, response times and remediation steps for every incident.
Correlate DDoS events, backup success rates and security alerts in one place so root cause investigations get faster.
Simple. Predictable. Powerful.
Lightweight agents are installed on each server during onboarding. They collect metrics at configurable intervals with negligible overhead on production workloads.
We work with your team to set thresholds, alert routing and severity levels so signals reach the right humans without drowning anyone in noise.
Dashboards aggregate metrics across your fleet — overview, per-server detail and service-level views — so daily operations and incident response both have what they need.
Our team monitors high-severity alerts around the clock and engages you for application-specific decisions. You stay in control; we provide the visibility and on-call backup.
Weekly and monthly reports highlight trends, incidents and capacity considerations. Use them for internal planning, customer-facing SLA reporting and post-incident learning.
Frequently asked questions
Detailed answers to the questions our customers ask most often about this service.
Explore other Server Trafficweb solutions that pair well with this service.
Enjoy seamless streaming with our offshore services. Unlock the secrets to uninterrupted streaming and say goodbye to buffering forever!


